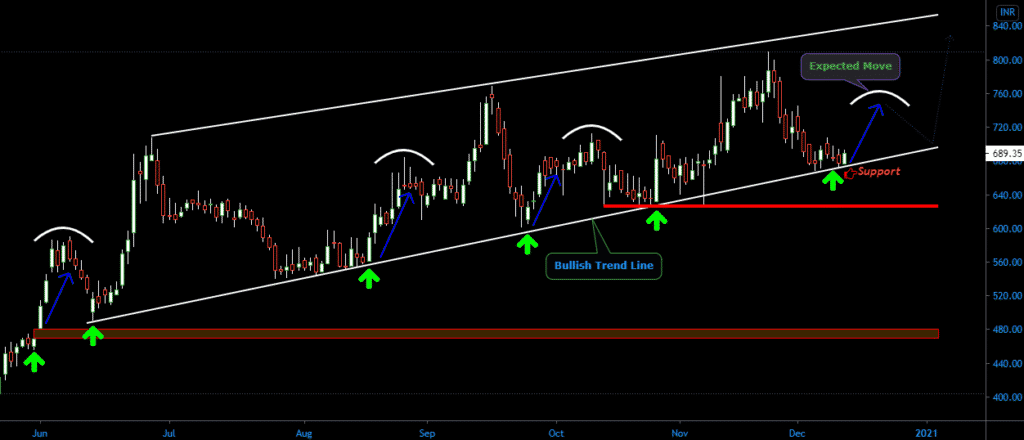
Trent Share Analysis
BSE: 500251 | NSE: TRENT | SERIES: EQ | ISIN: INE849A01020 |
Trent Limited is engaged within the retail sale of food, grocery, footwear, accessories, toys, games, non foodstuff & readymade garments. The Company’s segments include Retailing and others. It primarily operates stores across formats: Westside, Zudio, Star and Landmark. Westside offers apparel, footware and accessories for mens, women and youngsters , along side furnishing, decor and a variety of home accessories. It offers products in approximately 60 cities across over 90 stores in India.
| Current Price ₹ 689 | Market Cap ₹ 24,506 Cr. | Dividend Yield — |
| High / Low ₹ 809 / 365 | Book Value ₹ 59.2 | ROE 4.67 % |
| Stock P/E — | ROCE 16.9 % | Face Value ₹ 1.00 |
Trent Ltd. is in Uptrend and moving in a channel, Stock is trading near its support.
Buy Trent around Rs. 670 – 700 for the Targets of Rs. 725 and 746.
Stoploss Rs. 665.
Hodling period should be more than 15 Days..
CMP- 689 | Support- 665 | Resistance- 746 | Trend UP↑
Technical Analysis
| MOVING AVERAGES | Indication |
|---|---|
| Simple Moving Average (9) | Bullish |
| Simple Moving Average (18) | Bullish |
| Simple Moving Average (25) | Bullish |
| Simple Moving Average (43) | Bullish |
| Simple Moving Average (100) | Bullish |
| Simple Moving Average (200) | Bullish |
| OSCILLATORS | Indication |
|---|---|
| Commodity Channel Index (20) | Overbought |
| Williamson%R(14) | Overbought |
| MACD(12,26,9) | Bullish |
| Relative Strength Index (14) | Bullish |
| MFI(14) | Bullish |
| Stochastic(20,3) | Overbought |
| PIVOT LEVELS | R1 | R2 | R3 | PP | S1 | S2 | S3 |
|---|---|---|---|---|---|---|---|
| Classic | 696.20 | 703.05 | 713.15 | 686.10 | 679.25 | 669.15 | 662.30 |
| Fibonacci | 692.57 | 696.58 | 703.05 | 686.10 | 679.63 | 675.62 | 669.15 |
| Camarilla | 690.90 | 692.46 | 694.01 | 686.10 | 687.80 | 686.24 | 684.69 |
| Strengths |
|---|
| Annual Net Profit improving for last 2 years. |
| Company with Low Debt. |
| FII / FPI or Institutions increasing their shareholding. |
| Weaknesses |
|---|
| Degrowth in Revenue and Profit. |
| MFs decreasing their shareholdings. |
| Decline in Quarterly Net Profit with falling Profit Margin (YoY). |
| Daily Trend – Bullish ↑ |
| Weekly Trend – Bullish ↑ |
| Monthly Trend – Bullish ↑ |
Trent Share Analysis
Profile:- Trent Ltd.
Sector:- Retail
Industry:- Apparel/Footwear Retail
Employees:-
Trent Limited is engaged within the retail sale of food, grocery, footwear, accessories, toys, games, non foodstuff & readymade garments. The Company’s segments include Retailing and others. It primarily operates stores across formats: Westside, Zudio, Star and Landmark. Westside offers apparel, footware and accessories for mens, women and youngsters , along side furnishing, decor and a variety of home accessories. It offers products in approximately 60 cities across over 90 stores in India.
Quarterly Results Standalone
| Quarterly | SEP 2020 | JUN 2020 | MAR 2020 | DEC 2019 | SEP 2019 |
|---|---|---|---|---|---|
| Sales | 452 | 96 | 722 | 869 | 818 |
| Other Income | 36 | 52 | 34 | 38 | 43 |
| Total Income | 488 | 149 | 757 | 907 | 861 |
| Total Expenditure | 503 | 273 | 691 | 754 | 743 |
| EBIT | -15 | -124 | 66 | 153 | 117 |
| Interest | 58 | 57 | 59 | 59 | 59 |
| Tax | -25 | -42 | 4 | 38 | 19 |
| Net Profit | -48 | -139 | 2 | 55 | 38 |
Share Holding Pattern in (%)
| Standalone | June 2020 | March 2020 | December 2019 | September 2019 | |
|---|---|---|---|---|---|
| Promoters | 37.01 | 37.01 | 37.01 | 37.01 | |
| Pledged | 0 | 0 | 0 | 0 | |
| FII/FPI | 20.86 | 21.18 | 20.9 | 20.98 | |
| Total DII | 27.26 | 27.03 | 27.1 | 27.1 | |
| Fin.Insts | 0.03 | 0.04 | 0.03 | 0.04 | |
| Insurance Co | 3.39 | 2.75 | 2.75 | 2.78 | |
| MF | 11.81 | 11.84 | 12.15 | 12.21 | |
| Others DIIs | 12.03 | 12.4 | 12.17 | 12.07 | |
| Others | 14.88 | 14.78 | 14.99 | 14.91 | |
| Total | 100.01 | 100 | 100 | 100 |
Trent Share Analysis
Also Read | Intraday Stocks Watchlist | Stocks for Intraday Trading
Also Read | How To Make Money in the Stock Market? | 2 Easiest way to make money in stock market
Get Important Stock Market Update and Regular Stock Investment Ideas From StockFinz. Follow Us: Telegram | Twitter | Facebook | YouTube
(*Note:- The recommendation are based on technical analysis. There is a risk of loss.)

