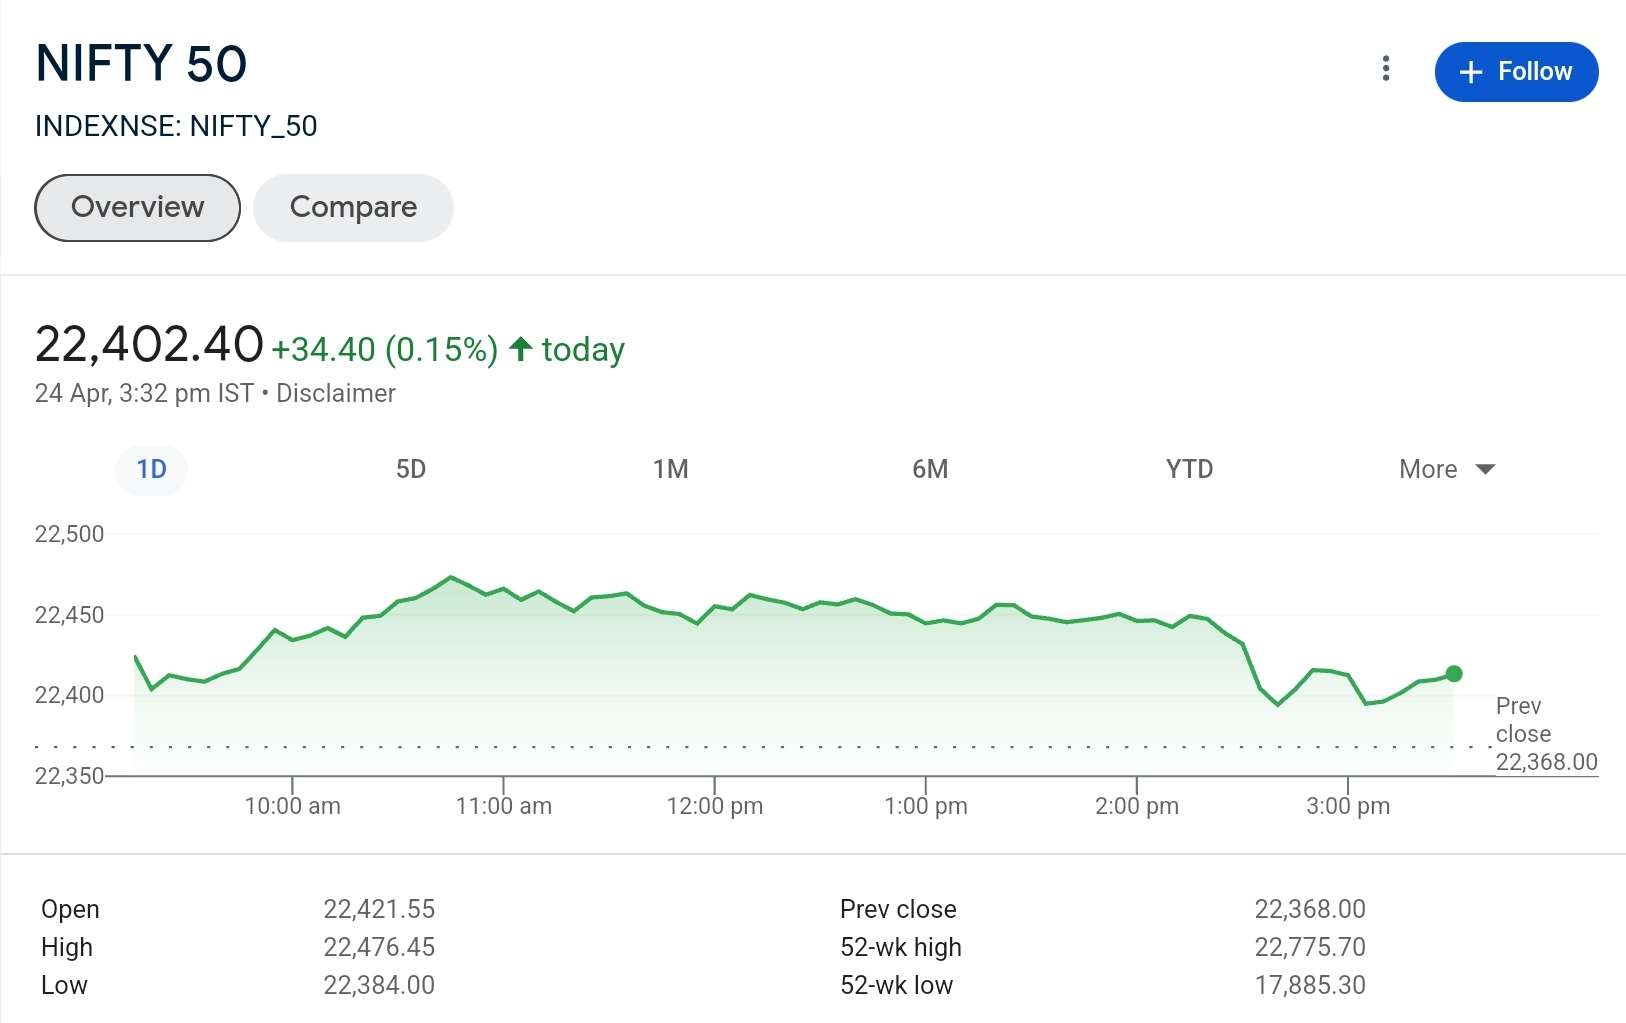
Ahead of the monthly F&O expiry planned for April 25, the Nifty 50 continued to trade erratically for an additional session. On April 24, it closed higher for the fourth day in a row. At last, the index moved above 22,400 and into the significant downward gap that was formed on April 15. Experts claimed that if the index is able to close the negative gap and cross 22,500, it may gradually move up to levels between 22,700 and 22,800, with support at 22,300.
As anticipated, the Nifty 50 began trading on April 24 higher, breaking through 22,400 and reaching 22,476, but in the final hour of trading, there was some selling pressure. But in the end, it pulled back and closed at 22,402, up 34 points. On the daily charts, this formed a little bearish candlestick pattern with a slight upper shadow.
Technically speaking, this pattern suggests that the market will move in a band between 22,450 and 22,500.
Experts Views on Nifty 50 trend
“At roughly 22,500 levels, Nifty is presently trading close to the critical overhead barrier of the previous opening negative gap that occurred on April 15. There is a greater likelihood of a clear upside breakout of the crucial resistance in the near future if the Nifty does not exhibit a significant decrease from near it, according to senior technical research analyst Nagaraj Shetti of HDFC Securities.
According to him, the Nifty’s short-term trend is rangebound and leaning upward. In the near future, the current rangebound action may lead to a clear upside breakout. In the near term, the next upside objective of 22,800 levels is anticipated to open with a strong move above 22,500. Levels of immediate support are 22,300–22,250,” he stated.
According to the monthly options data, on the day of the monthly expiry, the Nifty 50 is projected to face significant resistance at 22,500, 22,700, and 22,300, with support at the 22,300 level.
Maximum open interest on the call side was observed at 22,500, followed by 23,000 and 22,700 strikes. Significant writing was observed at 22,500, then 22,700 and 22,900 strikes. On the put side, the maximum open interest was observed at 22,000, followed by 22,300 and 22,400 strikes, with writing at 22,400, then 22,300 and 21,900 strikes.

Image Source
Bank Nifty
Four days in a row, the Bank Nifty continued its upward trajectory, increasing 219 points to 48,189 and formed an Inside Bar pattern on the daily charts that bears some resemblance to the Bullish Harami type of candlestick pattern (albeit not exactly).
“After a strong start, the Bank Nifty had a sideways trading session, staying steady around the 48,000–47,800 support zone. LKP Securities senior technical and derivative analyst Kunal Shah stated, “Immediate resistance is noted at 48,500, and a decisive breakthrough could signal further upside towards 49,500/50,000 levels.”
He believes that any pullbacks towards the support zone should be seen as buying opportunities as long as the general sentiment is still favorable.
In the meantime, the fear index, or India VIX, recovered 0.78 percent to 10.28 from 10.2, following an almost 20 percent decline in the previous session.
Read more such blogs at Stockfinz.


