How to Trade Double Top Pattern
Double Top Pattern
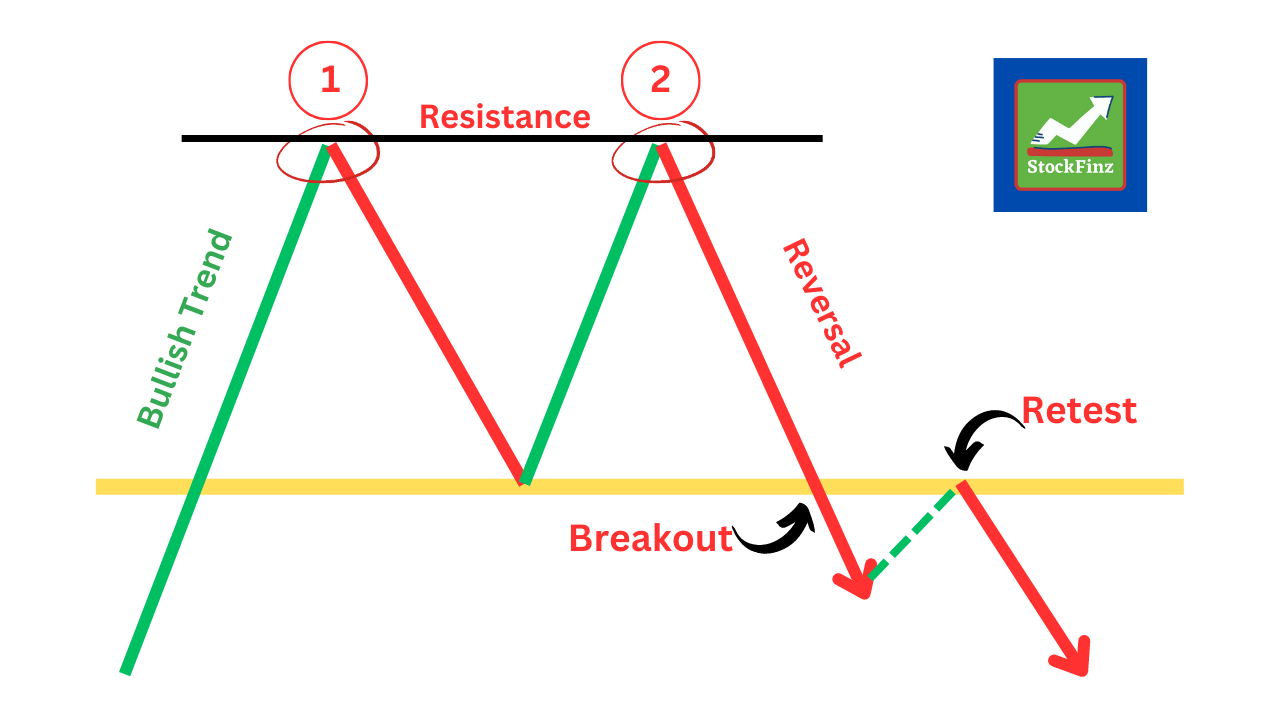
A double top is an extremely bearish technical reversal pattern that forms after an asset reaches a high price two consecutive times with a moderate decline between the two highs. It is confirmed once the asset’s price falls below a support level equal to the low between two prior highs.
How to Trade a Double Top Pattern
The pattern’s entry and exit rules are relatively simple. Although they may vary depending on the timeframe you use or the trading approach you implement, the standard points can be considered fundamental.
Entry
The two tops aren’t as important as the trough between them. This serves as the threshold that signals whether a trend reversal is occurring. A trader draws a horizontal line through it and waits for the price to fall below it after the second high is formed.
There are several options that traders can consider before entering the market. They can sell just after the breakout occurs; this is at the double top breakout candlestick. They can wait for the candle to close.
The choice depends on the timeframe and the risk approach. It’s risky to enter the market as soon as the breakout occurs because the price may turn around. The chances the breakout is valid increase when the candle closes below the neckline. If the timeframe is high, traders can even wait for the price to form a few candles. However, measuring the take-profit target and considering trading volumes is vital.
Take Profit
A take-profit level is determined by measuring the distance between the tops and the neckline. The theory says the price will go the distance equal to the difference between the neckline and the tops.
Open Account With OctaFx and Get StockFinz premium membership worth $500 FREE
Stop Loss
A stop-loss level can be calculated using the risk/reward ratio. The ratio is determined by considering the current market conditions, but it should be at least half the take-profit target. Additionally, it should always be placed above the neckline.
JOIN StockFinz FREE Telegram GROUP💸