Engineers India Stock Analysis
Engineers India belongs to the Industry of Project Consultancy/Turnkey Projects. Engineers India is a Government Enterprise under Ministry of Petroleum and Gas. Engineers India Ltd. is a Public Limited Listed company incorporated on 15 March 1965 and has its headquarter in Delhi, India.
| Current Price ₹ 78.8 | Market Cap ₹ 4,979 Cr. | Dividend Yield 6.54 % |
| High / Low ₹ 105 / 49.2 | Book Value ₹ 38.6 | ROE 17.8 % |
| Stock P/E 13.6 | ROCE 28.8 % | Face Value ₹ 5.00 |

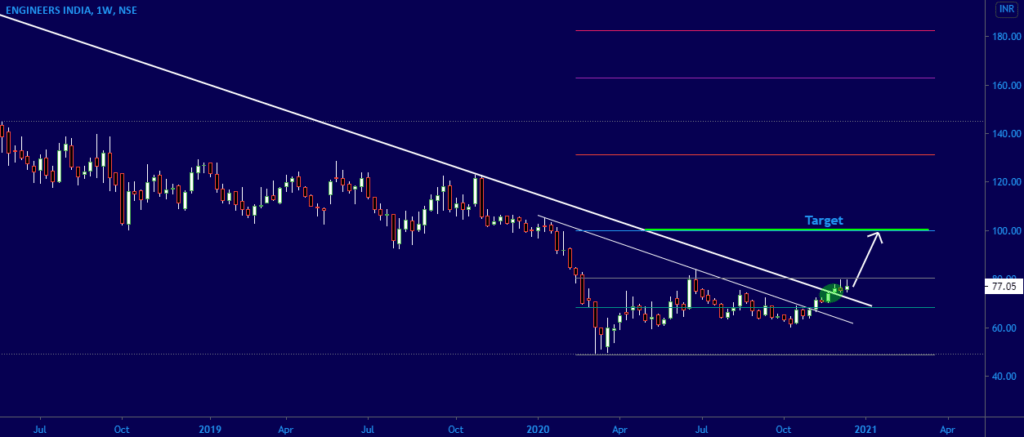
A breakout trade in Engineers India. Stock is looking bullish and trading near it’s support and trading above 200DMA. Sustining above 75 will boost this stock move upward.
Buy ENGINERSIN around Rs . 78 – 80 for the Targets of Rs .100 and 125.
Stoploss Rs .74.
Hodling period should be more than 1 Months..
CMP- 78.8 | Support- 74 | Resistance- 100 | Trend UP↑
Technical Analysis
| MOVING AVERAGES | Indication |
|---|---|
| Simple Moving Average (9) | Bullish |
| Simple Moving Average (18) | Bullish |
| Simple Moving Average (25) | Bullish |
| Simple Moving Average (43) | Bullish |
| Simple Moving Average (100) | Bullish |
| Simple Moving Average (200) | Bullish |
| OSCILLATORS | Indication |
|---|---|
| Commodity Channel Index (20) | Overbought |
| Williamson%R(14) | Overbought |
| MACD(12,26,9) | Bullish |
| Relative Strength Index (14) | Bullish |
| MFI(14) | Bullish |
| Stochastic(20,3) | Overbought |
| PIVOT LEVELS | Classic | Camarilla | Fibonacci |
|---|---|---|---|
| Resistance 1 | 79.42 | 78.93 | 79.14 |
| Resistance 2 | 80.03 | 79.07 | 79.48 |
| Resistance 3 | 80.87 | 79.20 | 80.03 |
| Pivot Point | 78.58 | 78.58 | 78.58 |
| Support 1 | 77.97 | 78.67 | 78.03 |
| Support 2 | 77.13 | 78.53 | 77.69 |
| Support 3 | 76.52 | 78.40 | 77.13 |
| Strengths |
|---|
| Growth in Quarterly Net Profit with increasing Profit Margin (YoY) |
| Company with Zero Promoter Pledge. |
| FII / FPI or Institutions increasing their shareholding. |
| Weaknesses |
|---|
| Declining Net Cash Flow : Companies not able to generate net cash |
| MFs decreased their shareholding last quarter |
| Earnings include an other income of Rs.233.14 Cr. |
| Daily Trend – Bullish ↑ |
| Weekly Trend – Bullish ↑ |
| Monthly Trend – Bullish ↑ |

Also Read | Jsw Steel Stock Analysis
Profile:- Engineers India Ltd.
Sector:- Industrial Services
Industry:- Engineering & Construction
Employees:-
Engineers India belongs to the Industry of Project Consultancy/Turnkey Projects. Engineers India is a Government Enterprise under Ministry of Petroleum and Gas. Engineers India Ltd. is a Public Limited Listed company incorporated on 15 March 1965 and has its headquarter in Delhi, India.
Quarterly Results Standalone
| Quarterly | Sep 2020 | Jun 2020 | Mar 2020 | Dec 2019 | Sep 2019 |
|---|---|---|---|---|---|
| Sales | 692 | 474 | 864 | 899 | 730 |
| Other Income | 49 | 50 | 66 | 66 | 63 |
| Total Income | 741 | 525 | 930 | 965 | 793 |
| Total Expenditure | 619 | 457 | 757 | 815 | 627 |
| EBIT | 122 | 67 | 172 | 150 | 166 |
| Interest | 0 | 0 | 0 | 0 | 0 |
| Tax | 32 | 17 | 43 | 37 | 99 |
| Net Profit | 90 | 49 | 128 | 112 | 66 |
Share Holding Pattern in (%)
| % | Mar 2019 | Jun 2019 | Sep 2019 | Dec 2019 | Mar 2020 | Jun 2020 | Sep 2020 | Dec 2020 |
|---|---|---|---|---|---|---|---|---|
| Promoters + | 52.00 | 52.00 | 52.00 | 51.50 | 51.50 | 51.50 | 51.50 | 51.50 |
| FIIs + | 6.58 | 6.58 | 7.82 | 8.62 | 7.59 | 7.59 | 4.43 | 5.55 |
| DIIs + | 25.53 | 26.08 | 24.78 | 23.30 | 25.52 | 25.52 | 22.98 | 21.29 |
| Public + | 15.89 | 15.35 | 15.40 | 16.59 | 15.40 | 15.40 | 21.10 | 21.67 |
Also Read | Intraday Stocks Watchlist | Stocks for Intraday Trading
Also Read | How To Make Money in the Stock Market? | 2 Easiest way to make money in stock market
Get Important Stock Market Update and regular stock investment ideas From StockFinz. Follow Us: Telegram | Twitter | Facebook | YouTube
(*Note:- The recommendation are based on technical analysis. There is a risk of loss.)


