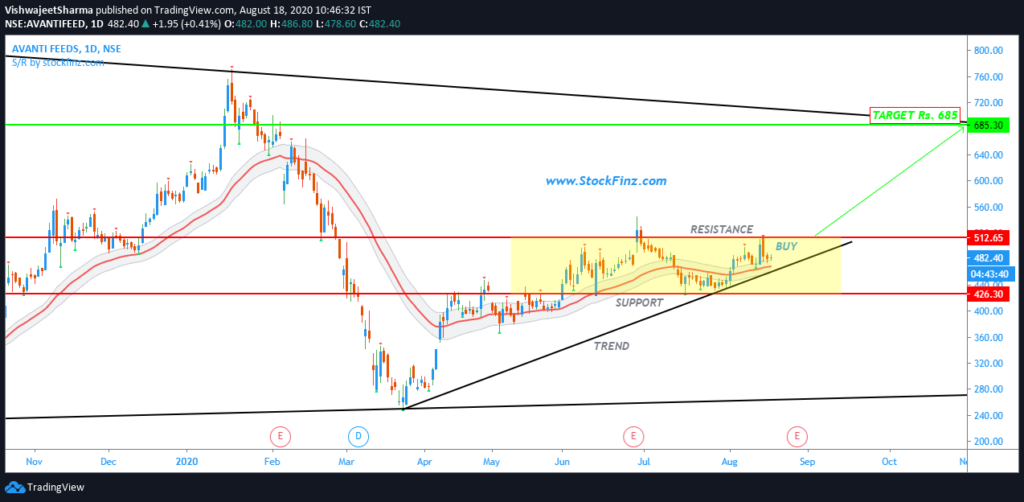
Avanti Feeds Stock Analysis
On the way to breakout.
Current Price: ₹482.40 (As on 18-Aug-2020)
Resistance: 512.65
Support: 426.30

Buy AVANTIFEED Around 480 – 515 for the Target of Rs. 685.
Stoploss Rs. 460
Hodling period should be 20-30 days
Technical analysis
MOVING AVERAGES
| Name | Action |
|---|---|
| Exponential Moving Average (5) | Bullish |
| Simple Moving Average (5) | Bullish |
| Exponential Moving Average (10) | Bullish |
| Simple Moving Average (10) | Bullish |
| Exponential Moving Average (20) | Bullish |
| Simple Moving Average (20) | Bullish |
| Exponential Moving Average (30) | Bullish |
| Simple Moving Average (30) | Bullish |
| Exponential Moving Average (50) | Bullish |
| Simple Moving Average (50) | Bullish |
| Exponential Moving Average (100) | Bullish |
| Simple Moving Average (100) | Bullish |
| Exponential Moving Average (200) | Bullish |
| Simple Moving Average (200) | Bullish |
OSCILLATORS
| Name | Action |
|---|---|
| Relative Strength Index (14) | Neutral |
| Stochastic %K (14, 3, 3) | Neutral |
| Commodity Channel Index (20) | Neutral |
| Average Directional Index (14) | Neutral |
| Awesome Oscillator | Neutral |
| Momentum (10) | Sell |
| MACD Level (12, 26) | Sell |
| Stochastic RSI Fast (3, 3, 14, 14) | Neutral |
| Williams Percent Range (14) | Neutral |
| Bull Bear Power | Neutral |
| Current Price: ₹480.45 | Stock P/E: 18.89 | Book Value: ₹103.03 |
| Market Cap: ₹6,546 Cr. | ROE: 26.55 % | Dividend Yield: 1.06 % |
| 52 weeks High: ₹770.00 | ROCE: 37.17 % | Sales Growth (3Yrs): 16.31 % |
| 52 weeks Low: ₹250.00 | Face Value: ₹1.00 |
Quarterly Results Standalone
| Quarterly | MAR 2020 | DEC 2019 | SEP 2019 | JUN 2019 | MAR 2019 |
|---|---|---|---|---|---|
| Sales | 764.76 | 657.68 | 832.91 | 907.22 | 662.25 |
| Other Income | 13.38 | 15.84 | 16.91 | 14.50 | 13.26 |
| Total Income | 778.14 | 673.52 | 849.82 | 921.72 | 675.51 |
| Total Expenditure | 681.63 | 630.71 | 733.40 | 799.85 | 594.56 |
| EBIT | 96.51 | 42.80 | 116.41 | 121.85 | 80.94 |
| Interest | 0.58 | 0.18 | 0.15 | 0.30 | 0.55 |
| Tax | 26.67 | 11.20 | 11.05 | 41.47 | 24.64 |
| Net Profit | 69.26 | 31.42 | 105.21 | 80.08 | 55.75 |
Strengths
| Growth in Net Profit with increasing Profit Margin (QoQ) | Company has been maintaining a healthy dividend payout of 20.60% |
| Company with Zero Promoter Pledge | Company with Low Debt |
Weaknesses
Share Holding Pattern in (%)
| Standalone | March 2020 | September 2019 | June 2019 | March 2019 | |
|---|---|---|---|---|---|
| Promoters | 43.69 | 43.72 | 43.76 | 43.76 | |
| Pledged | 0 | 0 | 0 | 0 | |
| FII/FPI | 17.83 | 13.93 | 13.7 | 13.42 | |
| Total DII | 23.34 | 25 | 24.89 | 25.49 | |
| Fin.Insts | 0.08 | 0.07 | 0.15 | 0.11 | |
| Insurance Co | 0 | 0 | 0 | 0 | |
| MF | 1.81 | 1.7 | 1.31 | 1.88 | |
| Others DIIs | 21.45 | 23.23 | 23.43 | 23.5 | |
| Others | 15.14 | 17.34 | 17.66 | 17.32 | |
| Total | 100 | 99.99 | 100.01 | 99.99 |
About: Avanti Feeds Ltd.
Also Read | Flipkart to acquire 8% stake in Aditya Birla’s fashion unit for $204 million
Also Read | Intraday Stocks Watchlist | Stocks for Intraday Trading
Get Important Stock Market Update and regular stock investment ideas From StockFinz. Follow Us: Telegram | Twitter | Facebook | YouTube
Subscribe to our newsletter!
(*Note:- The recommendation are based on technical analysis. There is a risk of loss.)


