
Mahindra & Mahindra is Following Trend and is now attempting to breakout to a new zone.
Update: All Targets Achieved.. Trade Closed…
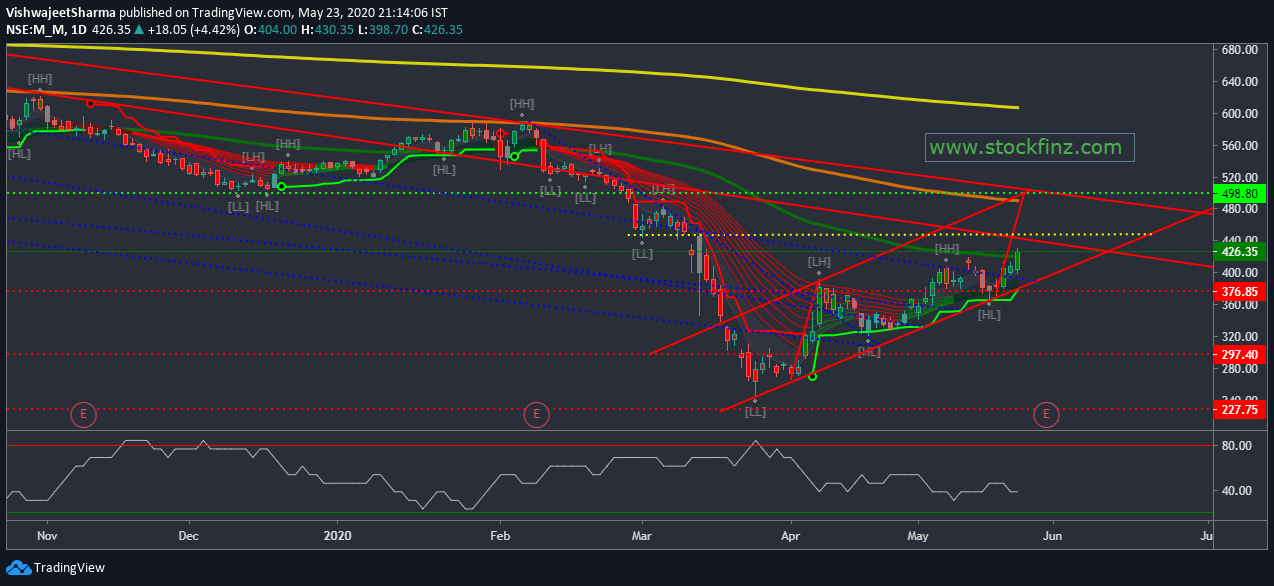
↑Buy-> M_M (Mahindra & Mahindra) Above-> 427 for the target of Rs. 448 – 498+++
Stop Loss Rs. 376
Holding period should be 10-12 days.
Technical analysis
MOVING AVERAGES
| Name | Action |
|---|---|
| Exponential Moving Average (5) | Bullish |
| Simple Moving Average (5) | Bullish |
| Exponential Moving Average (10) | Bullish |
| Simple Moving Average (10) | Bullish |
| Exponential Moving Average (20) | Bullish |
| Simple Moving Average (20) | Bullish |
| Exponential Moving Average (30) | Bullish |
| Simple Moving Average (30) | Bullish |
| Exponential Moving Average (50) | Bullish |
| Simple Moving Average (50) | Bullish |
| Exponential Moving Average (100) | Bullish |
| Simple Moving Average (100) | Bullish |
| Exponential Moving Average (200) | Bullish |
| Simple Moving Average (200) | Bullish |
OSCILLATORS
| Name | Action |
|---|---|
| Relative Strength Index (14) | Neutral |
| Stochastic %K (14, 3, 3) | Neutral |
| Commodity Channel Index (20) | Neutral |
| Average Directional Index (14) | Neutral |
| Awesome Oscillator | Neutral |
| Momentum (10) | Sell |
| MACD Level (12, 26) | Sell |
| Stochastic RSI Fast (3, 3, 14, 14) | Neutral |
| Williams Percent Range (14) | Neutral |
| Bull Bear Power | Neutral |
| Ultimate Oscillator (7, 14, 28) | Neutral |
Share Holding Pattern in (%)
| Standalone | March 2019 | December 2018 | September 2018 | December 2017 | |
|---|---|---|---|---|---|
| Promoters | 21.51 | 21.57 | 21.61 | 21.61 | |
| Pledged | 2.84 | 2.84 | 5.75 | 5.75 | |
| FII/FPI | 31.3 | 32.98 | 33.96 | 33.52 | |
| Total DII | 32.83 | 31.4 | 30.43 | 29.94 | |
| Fin.Insts | 0.26 | 0.22 | 0.19 | 0.17 | |
| Insurance Co | 12.65 | 11.29 | 11 | 11.21 | |
| MF | 10.49 | 10.27 | 9.94 | 8.71 | |
| Others DIIs | 9.43 | 9.62 | 9.3 | 9.85 | |
| Others | 14.35 | 14.05 | 14 | 14.94 | |
| Total | 99.99 | 100 | 100 | 100.01 |
Get Important Stock Market Update and regular stock investment ideas From StockFinz. Follow Us: Telegram | Twitter | Facebook | YouTube
(*Note:- The Watchlist are based on technical analysis. There is a risk of loss.)