Bliss GVS Pharma Ltd.
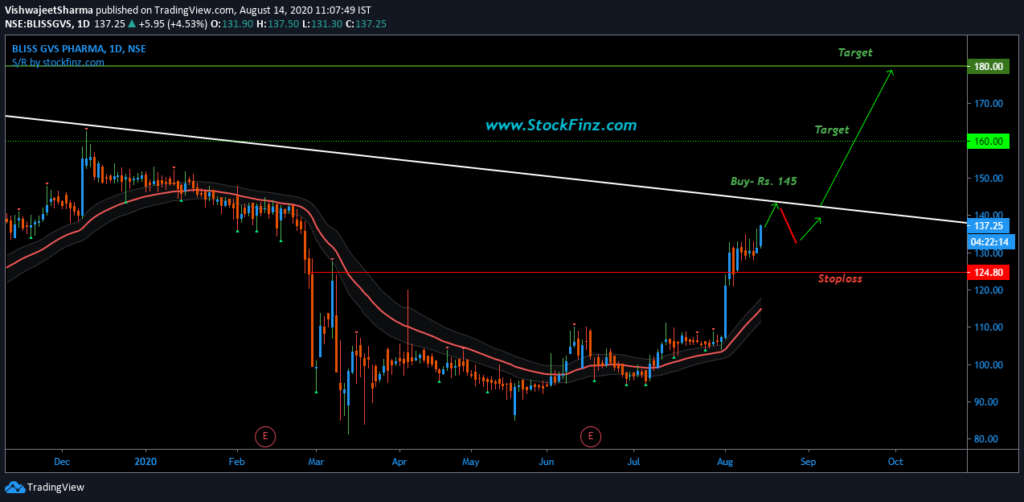
Very positive movement going on in Bliss GVS Pharma shares. Bliss GVS Pharma Ltd ( BLISSGVS ) is in downtrend since december 2017. Good levels to enter above 145.
Current Price: ₹133.05 (As on 15-Aug-2020)
Resistance: 145
Support: 124

Buy BLISSGVS Above Rs. 145 for The Target of Rs. 160 – 180..
Stoploss- 124
Hodling period should be 15 – 30days..
Strengths
| Company with Zero Promoter Pledge | Strong Momentum: Price above short, medium and long term moving averages |
Weaknesses
| Decline in Quarterly Net Profit (YoY) | Decline in Net Profit (QoQ) |
| Declining Revenue every quarter for the past 4 quarters | Degrowth in Revenue and Profit |
Technical analysis
MOVING AVERAGES
| Name | Action |
|---|---|
| Exponential Moving Average (5) | Bullish |
| Simple Moving Average (5) | Bullish |
| Exponential Moving Average (10) | Bullish |
| Simple Moving Average (10) | Bullish |
| Exponential Moving Average (20) | Bullish |
| Simple Moving Average (20) | Bullish |
| Exponential Moving Average (30) | Bullish |
| Simple Moving Average (30) | Bullish |
| Exponential Moving Average (50) | Bullish |
| Simple Moving Average (50) | Bullish |
| Exponential Moving Average (100) | Bullish |
| Simple Moving Average (100) | Bullish |
| Exponential Moving Average (200) | Bullish |
| Simple Moving Average (200) | Bullish |
OSCILLATORS
| Name | Action |
|---|---|
| Relative Strength Index (14) | Neutral |
| Stochastic %K (14, 3, 3) | Neutral |
| Commodity Channel Index (20) | Neutral |
| Average Directional Index (14) | Neutral |
| Awesome Oscillator | Neutral |
| Momentum (10) | Sell |
| MACD Level (12, 26) | Sell |
| Stochastic RSI Fast (3, 3, 14, 14) | Neutral |
| Williams Percent Range (14) | Neutral |
| Bull Bear Power | Neutral |
| Ultimate Oscillator (7, 14, 28) | Neutral |
| Current Price: 133.05 | Market Cap: ₹1,372 Cr. | Stock P/E: 13.43 |
| 52 weeks High 162.90 | Book Value: 71.32 | ROE: 21.19 % |
| 52 weeks Low 73.75 | Face Value: 1.00 | Sales Growth (3Yrs): 17.99 % |
| Dividend Yield: 0.75 % | ROCE: 26.90 % |
Quarterly Results Standalone
| Jun 2017 | Sep 2017 | Dec 2017 | Mar 2018 | Jun 2018 | Sep 2018 | Dec 2018 | Mar 2019 | Jun 2019 | Sep 2019 | Dec 2019 | Mar 2020 | |
|---|---|---|---|---|---|---|---|---|---|---|---|---|
| Sales + | 67 | 74 | 74 | 83 | 105 | 120 | 96 | 106 | 115 | 104 | 125 | 98 |
| Expenses + | 51 | 53 | 54 | 55 | 78 | 92 | 71 | 92 | 78 | 83 | 96 | 85 |
| Operating Profit | 16 | 21 | 20 | 28 | 27 | 28 | 25 | 14 | 37 | 21 | 29 | 13 |
| OPM % | 24% | 29% | 27% | 34% | 26% | 23% | 26% | 13% | 32% | 21% | 23% | 13% |
| Other Income | 2 | 6 | 1 | 4 | 13 | 24 | -4 | 3 | 2 | 12 | 6 | 15 |
| Interest | 2 | 2 | 2 | 2 | 1 | 1 | 1 | 1 | 1 | 1 | 1 | 2 |
| Depreciation | 1 | 1 | 2 | 1 | 1 | 2 | 1 | 1 | 2 | 2 | 2 | 2 |
| Profit before tax | 16 | 24 | 17 | 30 | 38 | 49 | 18 | 15 | 36 | 30 | 32 | 24 |
| Tax % | 34% | 34% | 39% | 31% | 28% | 37% | 36% | 69% | 34% | 7% | 25% | 30% |
| Net Profit | 10 | 16 | 10 | 20 | 27 | 31 | 12 | 5 | 24 | 28 | 24 | 16 |
| EPS in Rs | 1.00 | 1.55 | 1.01 | 1.97 | 2.62 | 3.01 | 1.13 | 0.45 | 2.32 | 2.76 | 2.28 | 1.59 |
Share Holding Pattern in (%)
| Standalone | March 2020 | December 2019 | September 2019 | March 2019 | |
|---|---|---|---|---|---|
| Promoters | 41.6 | 41.6 | 41.53 | 41.6 | |
| Pledged | 0 | 0 | 0 | 0 | |
| FII/FPI | 24.16 | 24.11 | 24.31 | 23.87 | |
| Total DII | 21.99 | 21.92 | 21.14 | 22.25 | |
| Fin.Insts | 0.05 | 0.74 | 0.62 | 1.14 | |
| Insurance Co | 2.91 | 2.91 | 2.91 | 0.48 | |
| MF | 0.01 | 0 | 0 | 0 | |
| Others DIIs | 19.02 | 18.27 | 17.61 | 20.63 | |
| Others | 12.25 | 12.37 | 13.01 | 12.28 | |
| Total | 100 | 100 | 99.99 | 100 |
Also Read | Flipkart to acquire 8% stake in Aditya Birla’s fashion unit for $204 million
Also Read | Intraday Stocks Watchlist | Stocks for Intraday Trading
Get Important Stock Market Update and regular stock investment ideas From StockFinz. Follow Us: Telegram | Twitter | Facebook | YouTube
Subscribe to our newsletter!
(*Note:- The recommendations are based on technical analysis. There is a risk of loss.)


