Image Source
Trade Setup for Friday: On May 23, the sentiment on Dalal Street became more optimistic as the benchmark indexes reached new record highs. The Nifty 50 moved closer to the critical 23,000 mark, which was partially led by short covering. Despite the fact that the market breadth was in favor of bears and the volatility remained high, the attitude on Dalal Street became more happy.
The Trade Setup for Friday
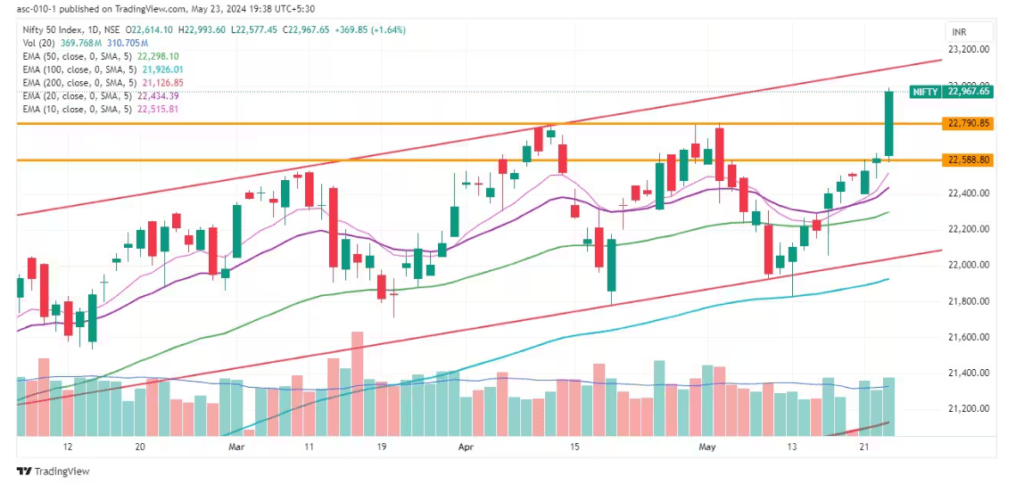
The index has been trading above all of the key moving averages and has maintained a formation of higher highs for the ninth consecutive session, which indicates that the technical setup appears to be more favorable. Consequently, experts believe that if the index is able to close strongly above the much-anticipated level of 23,000, then the level of 23,500 is the one to keep an eye on as the market approaches the results of the general elections, which are expected to be released the following month. Following the level of 22,800, which may serve as an immediate support, the level of 22,600 may serve as a crucial support.
A lengthy bullish candlestick pattern was created on the daily charts as trade setup for Friday. This signaled significant buying interest, and the Nifty 50 finished the day at a new closing high of 22,968, which represents an increase of 370 points or 1.64 percent from the previous settlement. The volume of trading was above average.
In the meantime, the Bank Nifty outpaced the Nifty 50, generating a powerful bullish candlestick pattern on the daily timescale and increasing by 987 points, which is equivalent to 2.06 percent, to reach 48,769 from its previous level. Now, it has traded above all of the important moving averages.
Important Levels for the Nifty 50 Index
In terms of resistance, the pivot points are as follows: 23,005, 23,103, and 23,262
The pivot points that provide support are as follows: 22, 687, 22,589, and 22,430
The index has experienced a breakout of a horizontal resistance trendline that is adjacent to previous record high levels. This is a special configuration. Furthermore, the relative strength index (RSI), which is a momentum indicator, reached 68.23 on the daily charts and experienced a positive crossover on the weekly charts. This result indicates that the RSI has moved well above the 60 mark.
Key Levels for the Bank Nifty
The pivot points that constitute resistance are as follows: 48,856, 49,082, and 49,447
The pivot points that provide support are as follows: 48,125, 47,899, and 47,534
49,332, 49,975 are the levels of resistance based on the Fibonacci retracement.
48, 120, 47, 907 are the levels of support based on the Fibonacci retracement.
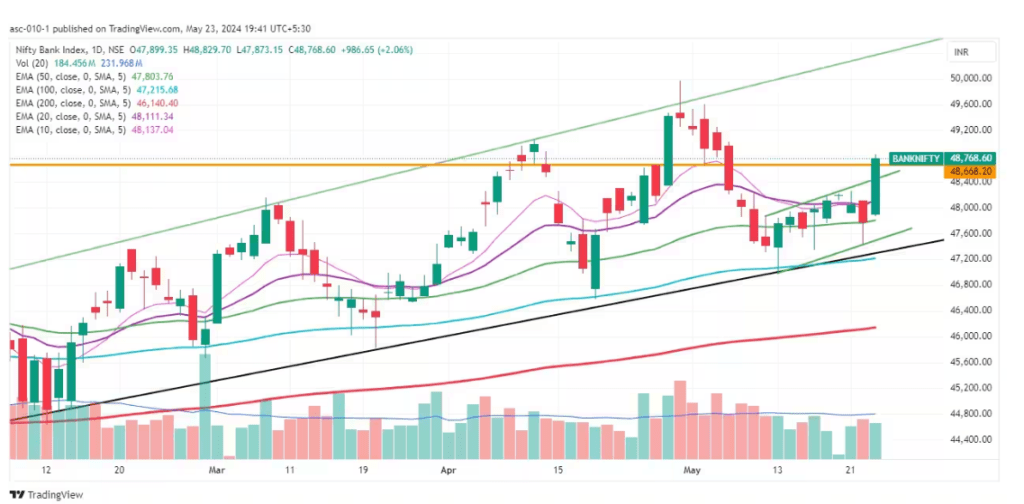
Image Source
Stocks Under F & O Ban
Businesses that have derivative contracts that exceed 95 percent of the market-wide position limit are included in the category of securities that are prohibited under the F&O sector.
The following stocks have been added to the F&O ban: NIL
Aditya Birla Capital, Balrampur Chini Mills, Bandhan Bank, Hindustan Copper, Indian Energy Exchange, India Cements, Metropolis Healthcare, National Aluminium Company, Piramal Enterprises, Punjab National Bank, and Zee Entertainment Enterprises are among the stocks that have been allowed to continue trading despite the restriction on foreign exchange and foreign exchange transactions.
Companies Biocon and Vodafone Idea have been removed from the F&O ban.
Read More: What is Bitcoin Mining